Power and Sample Size in Bioequivalence Studies: A Practical Guide
 May, 11 2026
Imagine spending millions of dollars on a generic drug trial, only to have the FDA reject it because your statistical plan was flawed. It sounds like a nightmare, but it happens more often than you might think. In Bioequivalence (BE) studies, which are clinical trials comparing the bioavailability of a test drug against a reference product, getting the numbers right isn't just good practice-it's the difference between approval and rejection.
The core challenge lies in balancing two critical factors: statistical power and sample size. If your study is too small, you risk missing true equivalence (a Type II error). If it’s too large, you waste resources and expose unnecessary subjects to risk. This guide breaks down exactly how to calculate these parameters correctly, avoid common pitfalls, and satisfy strict regulatory standards from the FDA and EMA.
Why Power Analysis Matters in BE Studies
Before you recruit a single subject, you need a solid power analysis. Think of statistical power as the probability that your study will correctly demonstrate bioequivalence if the test and reference drugs are truly equivalent. Regulatory agencies mandate this step to protect public health and ensure data integrity.
The standard significance level (alpha) is strictly set at 0.05. This represents the maximum acceptable risk of incorrectly concluding that two drugs are equivalent when they are not (Type I error). Meanwhile, statistical power (1-beta) is traditionally set at 80% or 90%. Here is what those numbers mean for you:
- 80% Power: Accepted by the European Medicines Agency (EMA) for most products. It means there is an 80% chance of proving equivalence if it exists.
- 90% Power: Often required by the US Food and Drug Administration (FDA), especially for Narrow Therapeutic Index (NTI) drugs. This higher bar reduces the risk of approving a substandard generic.
Failing to account for these requirements leads to underpowered studies. According to the FDA's Office of Generic Drugs, nearly 22% of Complete Response Letters cite inadequate sample size or power calculations as a primary deficiency. Don't let your study be one of them.
Key Parameters for Sample Size Calculation
To calculate the correct sample size, you cannot guess. You must input specific, justified values into your statistical model. The formula for crossover BE studies generally looks complex, but it boils down to four key drivers:
- Within-Subject Coefficient of Variation (CV%): This measures how much variability exists in the drug's absorption within the same person across different periods. High variability requires more subjects.
- Expected Geometric Mean Ratio (GMR): The anticipated ratio of the test drug to the reference drug. For generics, this is usually assumed to be close to 1.00 (e.g., 0.95-1.05).
- Equivalence Margins: Typically 80-125% for AUC and Cmax. Wider margins reduce the required sample size, while narrower ones increase it.
- Study Design: Most BE studies use a 2x2 crossover design. Parallel designs require significantly larger sample sizes due to between-subject variability.
Let’s look at a concrete example. If you expect a CV of 20%, aim for 90% GMR, target 80% power, and use standard 80-125% limits, you’ll need approximately 26 subjects. But if that CV jumps to 30%-perhaps due to a highly variable formulation-you suddenly need 52 subjects. That is a 100% increase in cost and complexity driven solely by variability.
| Within-Subject CV (%) | Required Subjects | Risk Level |
|---|---|---|
| 10% | 12-14 | Low |
| 20% | 26 | Moderate |
| 30% | 52 | High |
| 40%+ | 100+ (without RSABE) | Very High |
Handling Highly Variable Drugs
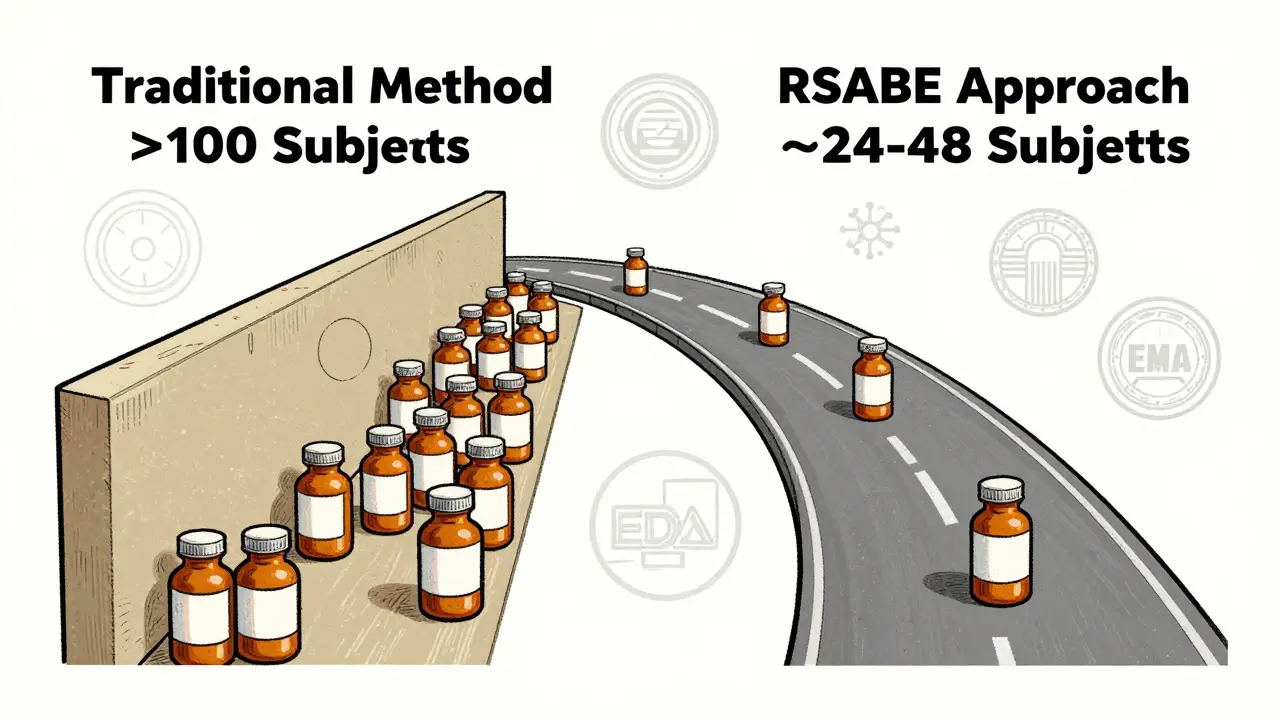
What happens when your drug has a CV greater than 30%? Traditional methods would demand unmanageable sample sizes, sometimes exceeding 100 subjects. This is where Reference-Scaled Average Bioequivalence (RSABE) comes into play.
RSABE is a regulatory-approved approach that adjusts the equivalence margins based on the variability of the reference product. If the reference drug is highly variable, the acceptance range widens slightly, allowing you to demonstrate equivalence with fewer subjects. For instance, instead of needing over 100 subjects, RSABE might reduce the requirement to 24-48 subjects.
However, RSABE is not a free pass. It applies primarily to Cmax and AUC for highly variable drugs. You must justify its use in your protocol and ensure your software supports the complex calculations involved. Tools like PASS 15 or nQuery offer specialized RSABE modules that align with FDA and EMA guidelines.

Common Pitfalls and How to Avoid Them
Even experienced statisticians make mistakes. Here are the most frequent errors that lead to failed BE studies:
- Overly Optimistic CV Estimates: Many sponsors rely on literature values for CV%. Dr. Laszlo Endrenyi notes that optimistic CV estimates caused 37% of BE study failures in oncology generics between 2015 and 2020. Always use conservative estimates from pilot data or add a buffer to literature values.
- Ignoring Dropout Rates: Life happens. Subjects drop out due to adverse events, non-compliance, or lost samples. Industry best practices recommend adding 10-15% to your calculated sample size to maintain adequate power after dropouts.
- Focusing on Only One Endpoint: You must demonstrate equivalence for both AUC (total exposure) and Cmax (peak concentration). The American Statistical Association recommends calculating joint power for both endpoints. Focusing only on the less variable parameter can leave your study underpowered for the other.
- Assuming a Perfect GMR: Assuming a test/reference ratio of exactly 1.00 when the true ratio is 0.95 increases the required sample size by 32%. Be realistic about formulation differences.
Software Tools for Accurate Calculations
You don’t need to derive formulas from scratch. Specialized software handles the heavy lifting, ensuring compliance with regulatory standards. Here are the top tools used by professionals:
- PASS (Power Analysis and Sample Size): Widely considered the gold standard for BE calculations. It offers comprehensive regulatory-aligned options and supports RSABE.
- nQuery: Excellent for adaptive designs and interim analyses. It provides robust simulation capabilities.
- FARTSSIE: A free tool that is great for quick checks, though it lacks some advanced features of commercial software.
- ClinCalc: User-friendly online calculator that provides real-time visualization of how parameter changes affect sample size.
Remember, software is only as good as the inputs. Document every assumption, including the software name, version, and justification for each parameter. The FDA’s 2022 review template explicitly requires this documentation, and incomplete records accounted for 18% of statistical deficiencies in recent submissions.
Regulatory Differences: FDA vs. EMA
If you are planning a global submission, you must navigate slight differences between regulators. While both aim for patient safety, their approaches vary:
- Power Requirements: The EMA generally accepts 80% power, whereas the FDA often expects 90% power, particularly for NTI drugs.
- Acceptance Ranges: The EMA permits a wider acceptance range of 75-133% for Cmax in certain cases, which can reduce sample sizes by 15-20% compared to the standard 80-125% range.
- Documentation: Both agencies demand rigorous justification, but the FDA tends to scrutinize the rationale for CV selection more heavily, noting that literature-derived CVs underestimate true variability in 63% of cases.
Aligning your study design with the stricter requirements (usually the FDA) from the start saves time and money later. It is easier to relax a constraint than to tighten it mid-study.
Future Trends in BE Statistics
The landscape is evolving. The FDA’s 2023 draft guidance introduces new requirements for sample size re-estimation in adaptive designs, allowing for more flexible trial conduct. Additionally, model-informed bioequivalence approaches are gaining traction. These methods use pharmacometric modeling to potentially reduce sample sizes by 30-50% for complex products.
While still limited to about 5% of submissions, this trend points toward a future where statistical rigor meets efficiency. However, traditional power analysis remains the backbone of BE studies. With 97% of industry statisticians expecting no major changes to fundamental requirements, mastering these basics is more important than ever.
What is the minimum sample size for a bioequivalence study?
There is no fixed minimum, but for low-variability drugs (CV < 10%), sample sizes as small as 12-18 subjects may be sufficient. However, most studies require 24-36 subjects to ensure adequate power and account for dropouts.
Why is statistical power important in BE studies?
Statistical power ensures that your study has a high probability (typically 80% or 90%) of correctly demonstrating bioequivalence if the test and reference drugs are truly equivalent. Low power increases the risk of Type II errors, leading to false negatives and costly study failures.
How does within-subject variability affect sample size?
Higher within-subject variability (CV%) dramatically increases the required sample size. For example, increasing CV from 20% to 30% can double the number of subjects needed. This is why accurate estimation of CV from pilot data is critical.
What is RSABE and when should it be used?
Reference-Scaled Average Bioequivalence (RSABE) is a method used for highly variable drugs (CV > 30%). It adjusts equivalence margins based on reference product variability, allowing for smaller sample sizes. It is typically applied to Cmax and AUC assessments.
Should I use literature values for CV% in my power calculation?
It is risky. Literature values often underestimate true variability. Experts recommend using conservative estimates from pilot studies or adding a buffer to literature values to avoid underpowering your study.
What is the difference between FDA and EMA BE requirements?
The FDA typically requires 90% power and stricter documentation, while the EMA accepts 80% power and allows wider acceptance ranges (75-133%) for Cmax in some cases. Aligning with FDA standards is often safer for global submissions.
Guy Birtwhistle
May 13, 2026 AT 10:30Look, I'm not saying this is rocket science, but apparently some people think they can just wing their sample size calculations and hope the FDA doesn't notice. Spoiler alert: they will notice. You want to spend millions on a trial that gets rejected because you were too cheap to recruit enough subjects? Cool story. Get your power analysis right or don't bother showing up.
Kenny Pines
May 15, 2026 AT 04:30Oh wow, another guide on bioequivalence 🙄 I guess we're all just going to pretend that calculating CV% is easy now. Like, seriously, who has time for this stuff when you could be out there making bad decisions? 😂 But hey, thanks for the info I guess. At least someone is trying to keep us from failing miserably. 🤷♂️
Liz and Nick
May 16, 2026 AT 01:11i mean its nice that you wrote all this but honestly why do we even need such strict rules cant we just trust that the drugs are basically the same? seems like a lot of hassle for no reason really and i bet most people just copy paste numbers anyway so what is the point of this long boring article
Brian Fibelkorn
May 17, 2026 AT 03:53The epistemological framework presented here is fundamentally flawed in its reliance on heuristic approximations for within-subject variability. One cannot simply assume a geometric mean ratio without rigorous prior distributional analysis. The failure to account for Bayesian hierarchical modeling in the context of Reference-Scaled Average Bioequivalence renders this entire discussion academically bankrupt. We must adhere to stricter methodological purism.
David Rangkhal
May 17, 2026 AT 21:45Hey guys lets just agree that doing the math right is important 🌟 I know it sounds dry but getting the sample size wrong costs real money and hurts patients so maybe we should all just try our best to follow the guidelines? No need to fight about it just do the work and be happy with the results ✨
Chelsea Grdina
May 18, 2026 AT 18:31I have been working in clinical trials for over ten years now and I can tell you that the difference between using PASS software and trying to do these calculations by hand is absolutely night and day, especially when you are dealing with highly variable drugs where the reference product itself has a ton of noise in the data which makes it incredibly difficult to pinpoint the exact equivalence margins without running into those nasty Type II errors that everyone hates so much because they mean you have to start the whole study over again from scratch which is a nightmare for everyone involved including the poor subjects who have to come back for more blood draws.
Sarah Kwiatkowski
May 20, 2026 AT 02:42This is such a helpful resource! I was struggling with understanding why my power kept dropping when I adjusted the GMR slightly away from 1.00. It makes total sense now that even small deviations require significantly larger sample sizes. Thank you for breaking down the joint power concept for AUC and Cmax, that really clarified things for me. Keep up the great work!
Brian LeClercq
May 22, 2026 AT 01:29It is utterly preposterous to suggest that American statisticians should bow to European laxity regarding power requirements. The FDA’s insistence on 90% power is not merely bureaucratic red tape; it is a bulwark against the mediocrity that plagues global pharmaceutical standards. To dilute our rigorous demands is to invite catastrophe upon our populace. We shall not compromise on excellence, nor shall we tolerate the soft underbelly of EMA acceptance ranges.
Jannet Suen
May 23, 2026 AT 15:18Sure, let's all just pretend that regulatory agencies read every single line of our protocols with a fine-toothed comb :) I've seen plenty of studies get away with minimal documentation, but yeah, good luck with that if you want to play it safe. Better to be over-prepared than sorry, I suppose. Don't forget to smile while you're doing your stats though, it helps with the stress levels.